Restaurant KPIs: 9 Best Key Performance Indicators for Restaurants
Which restaurant KPIs are most important? Hear what real restaurateurs think.

Tessa ZuluagaAuthor


Restaurant Cost Control Guide
Use this guide to learn more about your restaurant costs, how to track them, and steps you can take to help maximize your profitability.
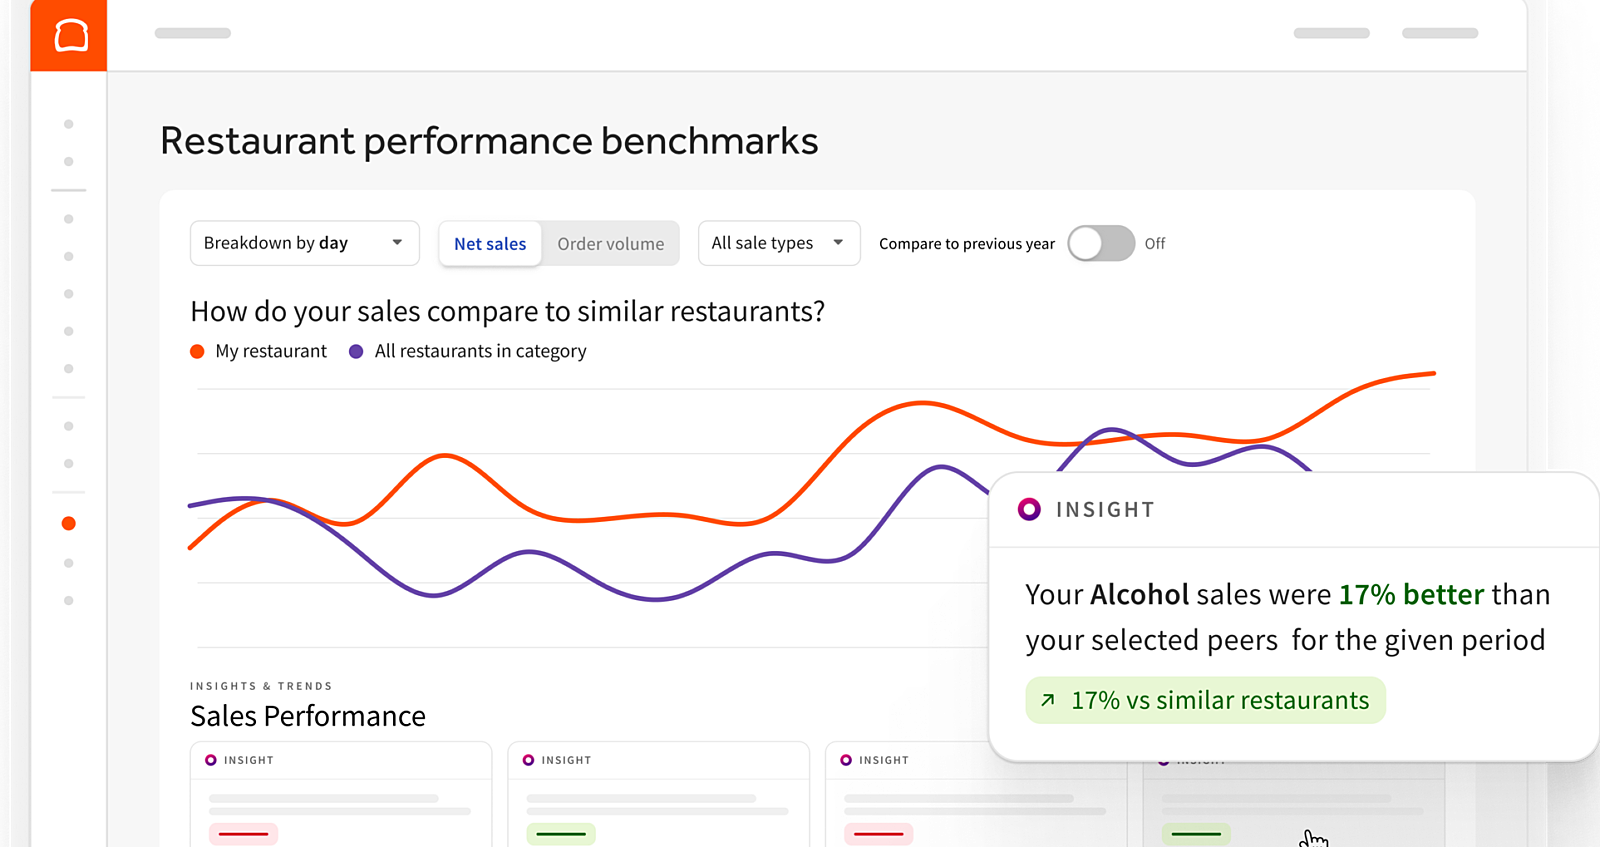
Data is the driving force behind successful many businesses these days, especially in the highly competitive restaurant industry. Toast found that 89% of Americans have dined out at a restaurant in the last 30 days. Therefore if people are going out, how do you know how your restaurant is performing compared to others?
While it may not be possible to define the “silver bullet” of restaurant metrics that determine the success or failure of the business, it's important to figure out where to focus.
So, which restaurant KPI is the most important? Check out some expert opinions below.
Restaurant Key Performance Indicators to Measure
Here are the top 9 key performance indicators that every restaurant business should measure.
1. Cash Flow
Cash flow is simply the amount of money going in and out of the restaurant. It’s essentially how much cash you have on hand. Naturally, you'd look for a positive cash flow where the cash input exceeds the cash output over a period of time.
Cash Flow = Cash Input- Cash Output
According to RunningRestaurants.com, “No matter if you are just starting your business or if you have been operating for several years, cash flow is the lifeblood of just about any entity, and in many cases, cash flow will dictate the success of an organization.”
2. COGS
COGS or Cost of Goods Sold refers to the cost required to create each of the food and beverage items that you sell to guests. COGS is often representative of the largest expenses for restaurants, making it an important metric for profitability.
COGS = Beginning Inventory + Purchased Inventory - Final Inventory
“The simple equation for running a restaurant is Total Sales - Expenses = Profit. As COGS are one of a restaurant’s largest expense categories (typically around 30% of gross sales) it is crucial to track them. That said, there are a lot of challenges - primarily stacks of paper invoices with ingredient pricing that fluctuates daily - but a restaurant management software can help organize and control COGS.” - Eric Jeffay, Director of Partnerships, MarginEdge.
3. Prime Cost
Rather than looking at ways to make more money overall, some strategists will urge you to first look at cutting expenses, like labor costs, to improve profitability. Prime Cost is the standard way of determining how much it costs to operate your restaurant and is a standard line item on your P&L statement.
Prime Cost = Total COGS + Total Labor
“The most profitable restaurants I've ever worked with all track their prime costs on a weekly basis. They don't wait around until their monthly or 4-week P&L is prepared to find out what happened,” says Jim Laube, founder of RestaurantOwner.com. “And for their efforts in preparing a weekly report, they are rewarded handsomely on their bottom lines.” I’d imagine that one of our blog contributors Ryan Gromfin would be inclined to agree with him.
4. RevPASH
RevPASH stands for Revenue Per Available Seat Hour during a given time period. Developed by Sheryl E. Kimes at Cornell University, RevPASH is used to optimize labor scheduling, plan food purchasing, and to improve table turn times.
RevPash = Total revenue / (available seats x opening hours)
RevPASH is a good measurement because it uses time and capacity in addition to average check to paint a clearer picture than just margins or average checks do on their own.
5. Retention or Repeat Visitor Rate
A restaurant is only as strong as its loyal customers. Some experts argue that all other metrics are moot points if the customer experience isn’t up to par. If acquiring a new customer is six to seven times more expensive than keeping an existing customer, this might be the best way to measure the success of the business.
Retention Rate = ((Number of customers at end of period - Number of new customers acquired during that period) ÷ number of customers at start of period)) x 100
According to Bloom Intelligence, “A loyal customer also costs a business less. Once acquired, the company has spent what they need to spend up front (at least for the most part). Losing that customer means having to replace them, and paying the costs of client acquisition all over again. Loyal customers will stay up to date on the brand, find answers to questions, and are willing to spend their social capital on the brands they love.”
Note: The most difficult thing about calculating Retention Rate is finding the data to plug into that formula. Check out systems with built-in customer relationship management tools to track customer history.
6. Break even point
The break-even point for a restaurant is the level of sales or revenue at which the total costs (fixed and variable) are equal to the total revenue generated. It's an important KPI because it helps restaurant owners and managers understand the minimum level of sales required to cover all expenses and avoid losses.
To calculate the break-even point, you need to know the restaurant's fixed costs (rent, salaries, utilities, etc.), variable costs (food, labor, etc.), and the selling price of the products or services. The formula is:
Break-Even Point (in units) = Total Fixed Costs / (Average Price per Unit - Variable Cost per Unit)
By monitoring and managing their break-even point, restaurants can make informed decisions about pricing, cost control, and sales strategies to ensure profitability.
7. Profit margin
There are 2 types of profit margins to consider when assessing your sales revenue.
Gross profit margin is the percentage of revenue remaining after deducting the cost of goods sold (food, beverages, etc.). It shows the profitability of a restaurant's operations before accounting for other expenses. A higher gross profit margin indicates better control over food costs and pricing strategies. To calculate it:
Gross Profit Margin = (Revenue - Cost of Goods Sold) / Revenue
Net profit margin is the percentage of revenue remaining after deducting all expenses, including cost of goods sold, labor, rent, utilities, and other operational costs. It represents the bottom-line profitability and is a crucial KPI for restaurant viability.
Net Profit Margin = Net Income / Revenue
Both margins are important for restaurants to monitor as they provide insights into operational efficiency, pricing power, and overall profitability.
Menu Engineering Worksheet
Use this menu engineering worksheet, complete with intricate menu engineering formulas, to determine areas of strength and weakness in your restaurant's menu.

8. Table turnover rate
This one is less financial, but instead focuses on how many customers you can serve per table per night. Table turnover rate is a key performance indicator that measures the number of times a restaurant's tables are occupied over a given period, usually per hour or per meal period. A higher table turnover rate means more customers are being served efficiently, leading to increased revenue potential. It's an important metric because it reflects the operational efficiency of the front-of-house staff, kitchen throughput, and dining room capacity utilization. To calculate table turnover rate:
Total Number of Parties Served / Total Number of Tables * Average Meal Duration (in hours)
Monitoring this KPI helps restaurants identify opportunities to improve seating arrangements, staffing levels, menu design, and service processes to maximize table utilization and revenue generation. To help turn tables faster check out this article.
9. Food cost percentage
Food cost percentage is a crucial operational metric that measures the cost of food ingredients and beverages as a percentage of the associated food and beverage sales revenue. It indicates how effectively a restaurant is managing its inventory, pricing, and portion controls. A lower food cost percentage generally means better profitability, assuming consistent quality and pricing. To calculate it:
Food Cost Percentage = (Cost of Food Sold / Food Sales Revenue) x 100
Maintaining an optimal food cost percentage is essential for restaurants to balance the costs of ingredients against menu pricing and ensure profitable operations. Factors like seasonality, supply chain costs, menu engineering, and food waste management can significantly impact this KPI, making it vital to monitor and control food costs proactively. If your food cost percentage is off, consider taking a look at your menu items and identifying which items are too costly for your business.
Customer feedback matters the most
There are many different KPIs and benchmarks to monitor to understand the success of your business. However, at the end of the day make sure one measurement it up: customer satisfaction. If your customers are happy they’ll spread the news through word of mouth and online reviews. In fact, 24% of restaurant goers are still using word of mouth to discover new restaurants. Consider using this template to ask your guests about their experiences in your restaurant. These survey questions will give you the data you need to make informed changes and improve the overall dining experience.
Is this article helpful?
DISCLAIMER: This information is provided for general informational purposes only, and publication does not constitute an endorsement. Toast does not warrant the accuracy or completeness of any information, text, graphics, links, or other items contained within this content. Toast does not guarantee you will achieve any specific results if you follow any advice herein. It may be advisable for you to consult with a professional such as a lawyer, accountant, or business advisor for advice specific to your situation.
Read More
Subscribe to On the Line
Sign up to get industry intel, advice, tools, and honest takes from real people tackling their restaurants’ greatest challenges.


