
How to Calculate Restaurant COGS and Boost Profitability
Calculating your restaurant cost of goods sold might seem like a pain, but it's an important part of making sure your business is healthy. Here's an easy way to calculate it.

Justin GuinnAuthor
Eric JeffayDirector of Partnerships, MarginEdge

Restaurant Cost Control Guide
Use this guide to learn more about your restaurant costs, how to track them, and steps you can take to help maximize your profitability.
 | BUILT FOR RESTAURANTS
Restaurant cost of goods sold — or restaurant COGS — refers mainly to the ingredient costs for your menu items.
Operators need to know how to calculate restaurant cost of goods sold in order to achieve strategic menu pricing. Restaurant COGS also enable restaurateurs to forecast profit margins for individual menu items, days of the week, different services (breakfast vs lunch vs dinner), and the business on the whole.
Regardless of your type of restaurant, tracking restaurant COGS is critical given the potential turbulence of the restaurant supply chain. Learning how to calculate COGS is a step toward truly taking control of restaurant costs and making data-driven decisions to reduce your operational overhead expenses.
In this article, you will learn how restaurant COGS calculations can help you keep your business running efficiently. See how to calculate it manually and with automated systems, and explore tips to help lower cost of goods sold.
The simple equation for running a restaurant is Sales - Expenses = Profit. As COGS are one of a restaurant’s largest expense categories (typically around 30% of gross sales) it is crucial to track them. That said, there are a lot of challenges - primarily stacks of paper invoices with ingredient pricing that fluctuates daily - but a restaurant management software can help organize and control COGS.
Eric Jeffay
Director of Partnerships, MarginEdge
Restaurant Operator Insights Report
See insights from real restaurant operators which can help you benchmark your current and planned restaurant technology stack against your peers as we head into 2024 and beyond.

Importance of knowing how to calculate COGS for your restaurant profit margins
Restaurant COGS refers to the cost of all the ingredients a restaurant uses in a given time period.
Knowing how to calculate COGS is critical for the restaurant industry for monitoring and controlling restaurant costs. It’s not some calculation reserved for accountants. Restaurant COGS numbers change over time, and you'll see a completely different number when comparing your COGS for one shift to your COGS for an entire year.
Calculating COGS requires you to track restaurant ingredient costs over a given amount of time. Tracking total food cost percentages can enable you to stay lean and keep operating expenses low — allowing restaurant operators to save money on food inventory by identifying patterns and trends.
Restaurant Operator Insights Report
See insights from real restaurant operators which can help you benchmark your current and planned restaurant technology stack against your peers as we head into 2024 and beyond.
Restaurant COGS can highlight which food costs are eating away at your gross profits
When building out your restaurant profit and loss statement, your cost of goods sold is subtracted from your gross revenue, since this is money that you either owe or have already paid — thus, higher restaurant COGS mean lower restaurant profit margins.
COGS tells you how much you are spending to make your food sales and drink sales across your restaurant operation — individual locations, shared concepts, or an entire portfolio.
The COGS/Sales ratio quantifies your spend relative to revenue. A lower ratio is preferred as it suggests you’re spending less to make more money. It’s generally a sign of good financial health.
COGS typically vary between restaurants depending on factors like size and concept.
Consider a fine dining restaurant vs. a fast food one. Fine dining generally has higher COGS because they use better quality, more expensive ingredients. This higher COGS isn’t necessarily alarming because they then charge a premium to more than cover these costs.
That being said, a good average COGS ratio to aim for is usually around 31%.
You can track COGS and COGS ratio over time to identify trends and determine if you’re in control of your costs.
For example, if COGS consistently rise for three months while turnover remains constant, you may have a problem. Maybe suppliers have increased their prices, and you haven’t adjusted yours. Perhaps food waste and spoilage in the kitchen is higher than usual due to several new hires or a bad round of produce.
COGS is most definitely a critical restaurant accounting KPI, but it needs to be a starting off point and not your only metric — much like restaurant inventory turnover ratios, restaurants need more precise insights to accompany COGS measures.
Restaurant Metrics Calculator
Use this free calculator to calculate the key restaurant metrics needed to understand the health and success of your business.
How to calculate cost of goods sold for restaurants
Here’s a COGS formula you can use to calculate your restaurant cost of goods sold.
Beginning Inventory + Purchased Inventory – Ending Inventory = Cost of Goods Sold (COGS)
Let's break this down with an example:
Say you want to get a better idea of your inventory from last month. You had $3,000 of leftover inventory at the start of the month, including food, drinks, spices, and other materials — basically anything and everything it takes to get a meal on a plate and a drink in a glass.
Throughout the month, you ordered $8,000 of additional inventory and ended the month with $2,000 worth of inventory.
Now let's tie these number into the variables from the equation:
Beginning Inventory: $3,000
Purchased Inventory: $8,000
Ending Inventory: $2,000
Then, plugging those numbers into the restaurant cost of goods sold equation, we get this:
Cost of Goods Sold = Beginning Inventory + Purchased Inventory – Ending Inventory
Cost of Goods Sold = $3,000 + $8,000 – $2,000
Cost of Goods Sold = $9,000
In this example, your restaurant's cost of goods sold — or the amount of money spent on food and drink served in your establishment during the month — reaches a total of $9,000.
You can play around with the numbers a bit using this interactive restaurant cost of goods sold calculator.
The calculator asks you to sum up all of your COGS and will help you break down your food and drink items with greater specificity.
A good COGS rate for successful restaurants is half your prime costs
A good average COGS ratio to aim for is between 30-35% — or about half of your restaurant prime costs.
You can track your restaurant COGS and COGS ratio over time to identify trends and determine if you’re truly controlling your total food costs.
For example, if your restaurant COGS is consistently rising for three months while inventory turnover rates remain constant, you may have a problem. Maybe suppliers have increased their cost of ingredients, and you haven’t adequately adjusted. Perhaps food waste in the kitchen is higher than usual due to several new hires.
COGS is most definitely a critical restaurant accounting KPI, but it needs to be a starting off point and not a restaurateur’s only metric. Much like restaurant inventory turnover ratios, successful restaurants need more precise insights into overall costs and operating expenses to accompany COGS measures.
How can restaurants take control of their food costs?
Food cost percentages have been hard to tame for many restaurants as food inflation has raged over the past few years.
To better understand how restaurants navigate the current climate and their priorities for the future, from May 26, 2023 to June 20, 2023, Toast polled 8471 restaurant decision-makers for its annual Voice of the Restaurant Industry Survey.
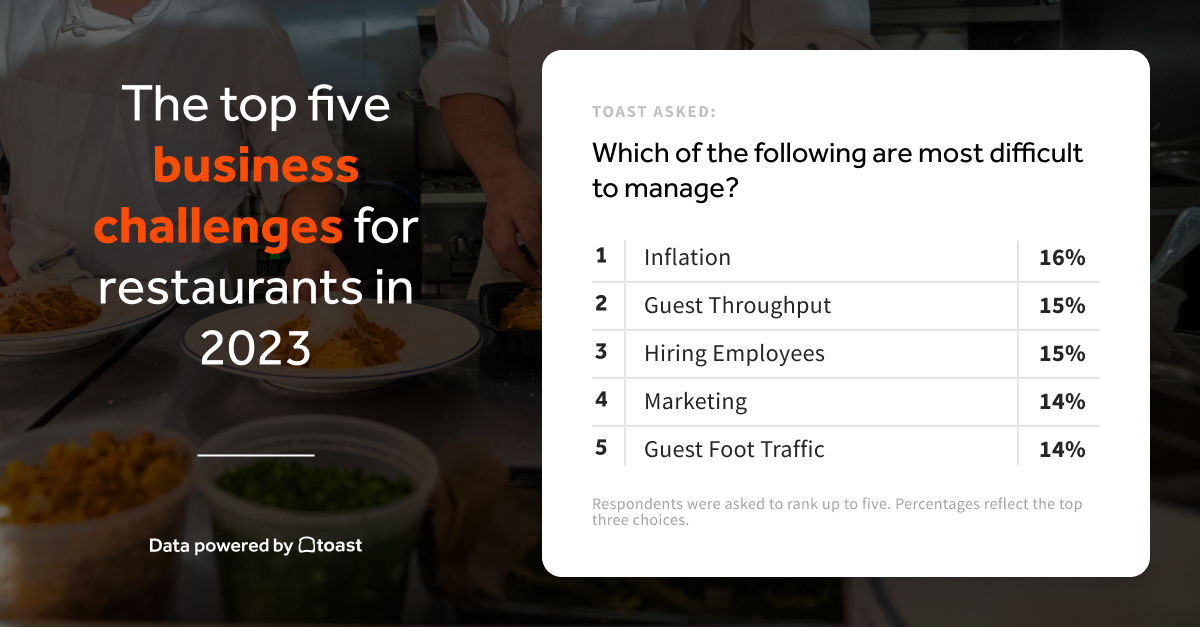
Inflation remained the top pain point for restaurant operators for the second year. However, there have been some significant improvements in inventory and employee management, which were the top concerns in our 2022 survey.
The survey also found that restaurant operators used similar tactics to combat inflation in 2023 as in 2022 — as 42% of operators we polled say they raised menu prices as a reaction to inflation in the past 12 months. That's compared to 36% who responded to our survey in 2022.
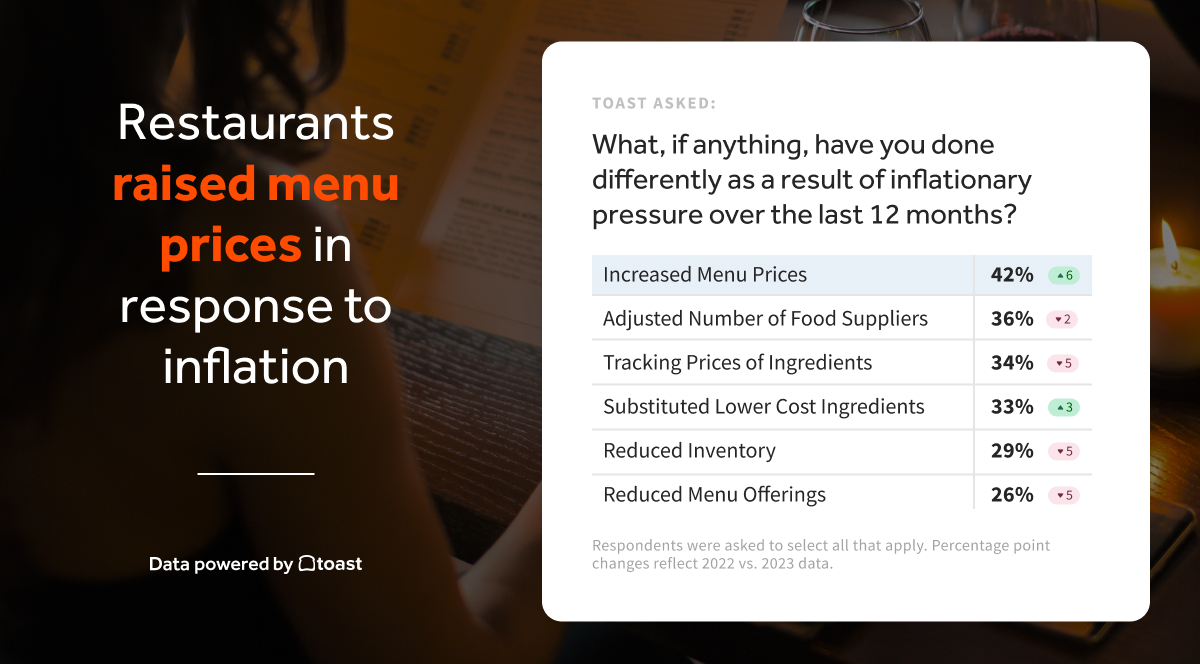
Respondents also cut costs by shopping different suppliers, tracking ingredients, substituting lower-cost ingredients, and reducing inventory and menu offers.
Take a look at our 2023 Restaurant Operator Insights report to get more actionable operational insights as you look to achieve sustainable growth for your restaurant business.
Restaurant Operator Insights Report
See insights from real restaurant operators which can help you benchmark your current and planned restaurant technology stack against your peers as we head into 2024 and beyond.
Don’t let COGS be a broken cog in your restaurant profit margin
COGS is a great high-level, actionable measure for your food costs, though restaurants may benefit from a more precise, detailed overview of their spending.
Even with our formulas and synopsis above, manually tracking restaurant food costs has typically been time-consuming and error prone.
Restaurant operators can consider implementing a few restaurant management tactics to help lower cost of goods sold and boost their bottom lines.
Optimizing inventory management to reduce COGS
Restaurant inventory management is the foundation of your COGS calculation. Beyond calculating COGS, food inventory tactics can help operators make more informed decisions about supplier orders and ingredients to stock, portion size control, and food waste and spoilage.
Restaurant inventory management can be crucial for restaurant success — contributing to your food cost control.
Implementing consistent, reliable inventory counts can help you see the supplies come into your restaurant, which and how many ingredients leave your kitchen during a service, the total amount of inventory leftover after each service, and what’s wasted along the way.
Without knowing these exact numbers, you won't be able to understand where your supply (and money) is going.
Tracking food cost percentage
It's critical that restaurant owners, operators, and managers consistently track food cost percentages and the right mix of technology to take control of costs and lay the groundwork for optimizing restaurant profits.
Food cost percentage is calculated by taking the cost of goods sold and dividing that by the revenue or sales generated from that finished dish.
Achieving close to real-time recipe costing
The right mix of restaurant technology can help operators understand gross profit, net profit, and total costs at the individual restaurant menu item level.
Invoice automation can be an unsung hero here. Cost control tools such as xtraCHEF by Toast, empower restaurant owners to go beyond spreadsheets and automatically process supplier invoices so that ingredient prices are pulled into the system to update recipe costs.
This is an incredibly nuanced and detailed process, but the results can help propel your restaurant business to sustained success with lower costs, higher total revenue, and a lovely gross profit margin.
Implementing ongoing menu engineering to lower COGS
Menu engineering is an effective, scalable process for balancing your menu between popularity and profitability. The goal is to harmonize costing and pricing information with your restaurant vibes and brand — all while maintaining or improving customer satisfaction.
You can use sales data as well as knowledge on COGs and other attributable restaurant expenses to rank menu items. This ranking enables you to matrix menu item popularity with menu item profitability. With that matrix, you can conduct forecasting exercises to understand what combination of menu items can create the best blend of total sales, lower COGS, and overall profitability.
Point of sale (POS) system built for restaurants
Your point of sale (POS) system is the foundation of your restaurant technology stack. It’s purpose can extend far beyond inputting orders processing transactions.
Your POS system can unlock tons of cost control and forecasting insights if it has key integrations with invoice processing, inventory management, and similar tools.
You can combine sales data from the POS with these costing insights to start making more informed decisions.
Schedule a demo to speak with a product specialist today about the potential benefits of Toast and xtraCHEF for your operation.
Is this article helpful?
DISCLAIMER: This information is provided for general informational purposes only, and publication does not constitute an endorsement. Toast does not warrant the accuracy or completeness of any information, text, graphics, links, or other items contained within this content. Toast does not guarantee you will achieve any specific results if you follow any advice herein. It may be advisable for you to consult with a professional such as a lawyer, accountant, or business advisor for advice specific to your situation.

Subscribe to On the Line
Sign up to get industry intel, advice, tools, and honest takes from real people tackling their restaurants’ greatest challenges.